How Pricing and Promotions Drive Sales Growth
This study investigates how pricing and promotional strategies, including competitor influence, impact the sales of Herbal Essences using the SCAN*PRO model and store-level scanner data.
Executive Summary
This study developed a descriptive model to analyze the impact of pricing and promotions on sales for the top market share brand, Herbal Essences. The dataset initially included 5,195 records across 11 brands, 109 weeks, and 48 stores. After cleaning and filtering the data, the final analysis used 436 observations for the top 5 brands in four stores over 109 weeks.
The dependent variable was sales units for Herbal Essences, and the key independent variable was the actual price. Using the Scan Pro model and logarithmic transformations for these variables, three models were tested:
The impact of Herbal Essences' pricing and promotions on its sales.
Fixed effects to assess variation between stores.
The effect of competitors' prices on Herbal Essences.
Key findings include:
Combining display and feature promotions significantly increases sales.
Baseline sales vary between stores, but price elasticity is consistent.
TRESemmé's pricing significantly affects Herbal Essences sales.
The model exhibits moderate multicollinearity and positive autocorrelation.
Data analysis was performed using SAS Enterprise Miner (SAS EM).
1.Introduction
Understanding the impact of pricing on sales is critical for brands seeking to increase market share and profitability. The SCAN*PRO model is a multiplicative model that quantifies the effect of pricing and promotions on unit sales at the store level.
This study explores:
How Herbal Essences’ pricing and promotions affect its sales
The role of store-level fixed effects
The influence of competitor pricing on focal brand sales
2.Data Description
2.1 Dataset
The dataset initially included 5,195 records across 11 brands, 109 weeks, and 48 stores.
2.1.1 Variables
- Explanatory Variables:
actpr2,actpr3,actpr4,actpr5,actpr8,coupon2,feature2,display2,display_feature2,display_coupon2,shopnr3361,shopnr3362,shopnr3365,store1_price,store2_price,store3_price - Response Variable:
sales2
All price and sales variables were transformed using log.
2.1.2 Dummy Variables
| Variable name | Description |
|---|---|
Feature_i | 1 if promotion is feature-only (text or picture) |
coupon_i | 1 if promotion is coupon |
display_i | 1 if promotion is display-only |
display_coupon_i | 1 if promotion is display with coupon |
display_feature_i | 1 if promotion is display with feature |
store3361 | 1 if shopnr is 3361 |
store3362 | 1 if shopnr is 3362 |
store3365 | 1 if shopnr is 3365 |
2.1.3 Interaction Variables
| Variable name | Description |
|---|---|
store1_price | shop3361 * actpr2 |
store2_price | shop3362 * actpr2 |
store3_price | shop3365 * actpr2 |
2.2 Data Preprocessing
2.2.1 Market Share
Market share was calculated based on total sales.
Figure 1: Market share for all brands
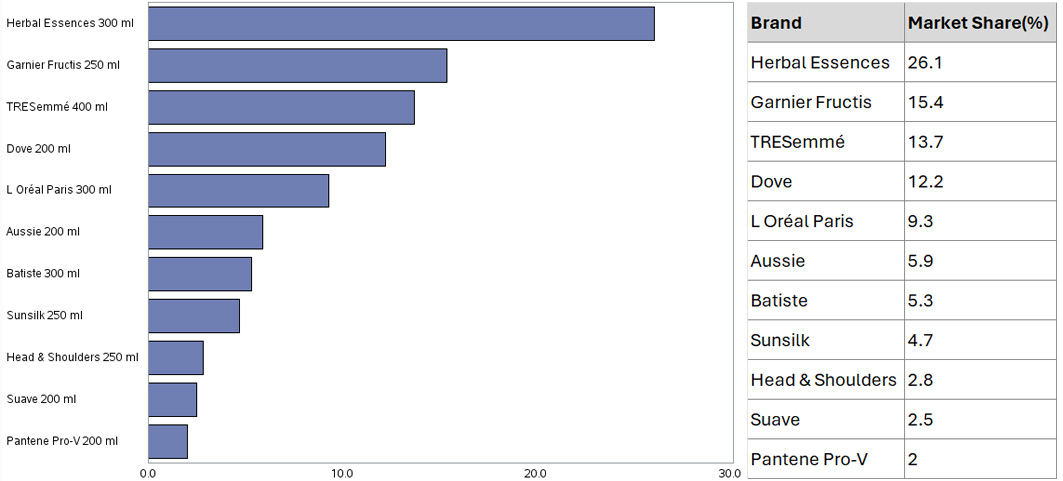
As shown in Figure 1, Herbal Essences was the leading brand. The top five brands together account for nearly 80% of the market. To assess the impact of competitors on Herbal Essences, the next four brands by market share were selected: Garnier Fructis, Dove, TRESemmé and L'Oréal Paris.
2.2.2 Missing Value
Figure 2: Summary statistics for key variables
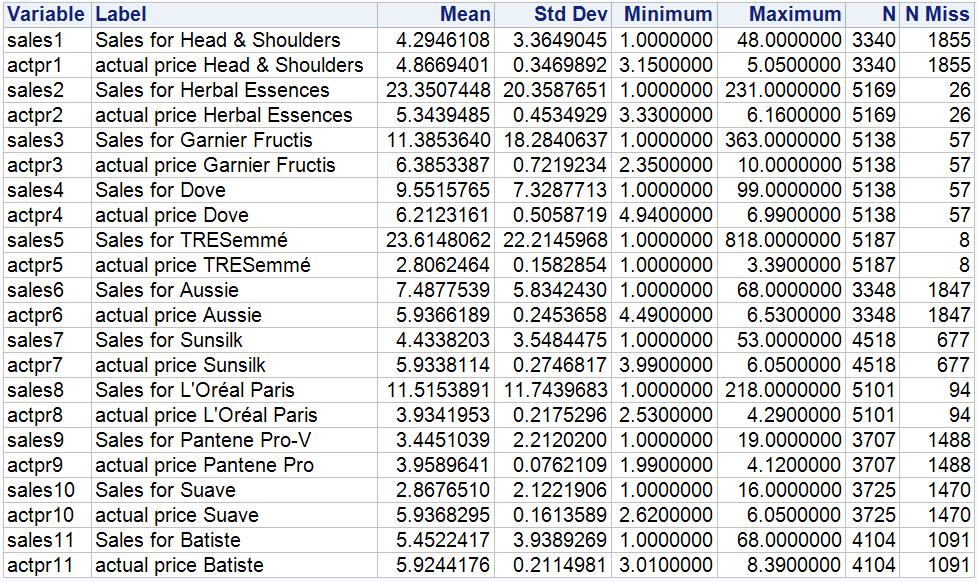
As can be seen in Figure 2, there is a pattern in the number of missing values, with the same number of missing variables for the same brand. A review of the original dataset reveals that the missing entries for a brand in a particular store for that week are not random, most likely because the store does not stock that brand.
Therefore, it is not appropriate to impute missing values with data from other weeks. This is because each row in the dataset represents the sales of all brands in a store during a week. Imputing missing data column by column can hinder our understanding of how brands interact with each other. Therefore, the approach to dealing with missing values is to filter the data to preserve non-null values for the top 5 brands.
In addition, the dataset is a panel data structure; maintaining time continuity is critical. Thus, only stores with 109 weeks of complete data were selected for the time series analysis. Furthermore, to evaluate the fixed effects across these stores, the analysis was limited to four stores to simplify the model.
The final dataset contains 436 observations, covering five brands in four stores over a period of 109 weeks.
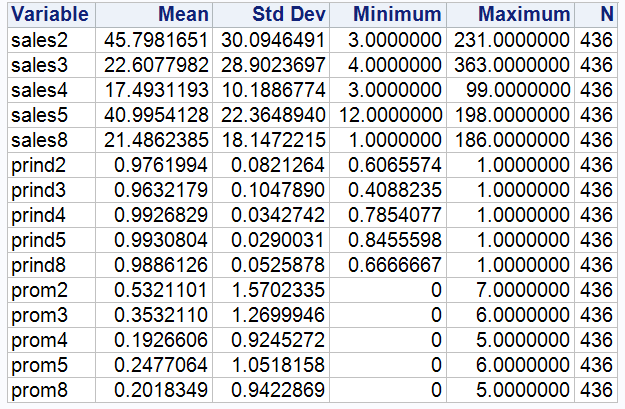
Figure 3: Final dataset summary statistics for key variables
2.3 Data Exploration
2.3.1 Market Mix for Herbal Essences
Figure 4: Herbal Essences use of promotion types
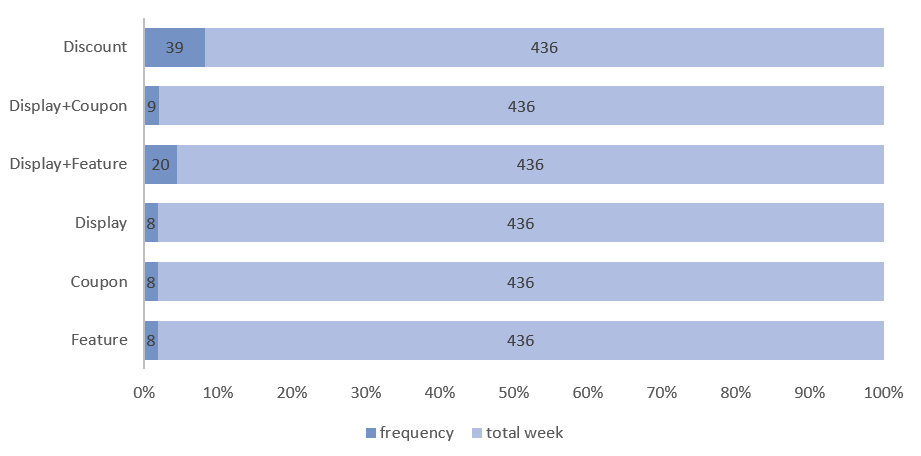
Figure 4 shows the distribution of promotional strategies used by Herbal Essences, highlighting the brand's efforts to increase sales. Discounts were the most common tactic, used in 39 out of 436 weeks. The "Display + Feature" strategy was used 20 times, making it the second most common approach.
2.3.2 Performance for Herbal Essences
Figure 5: Herbal Essences sales performance across four shops
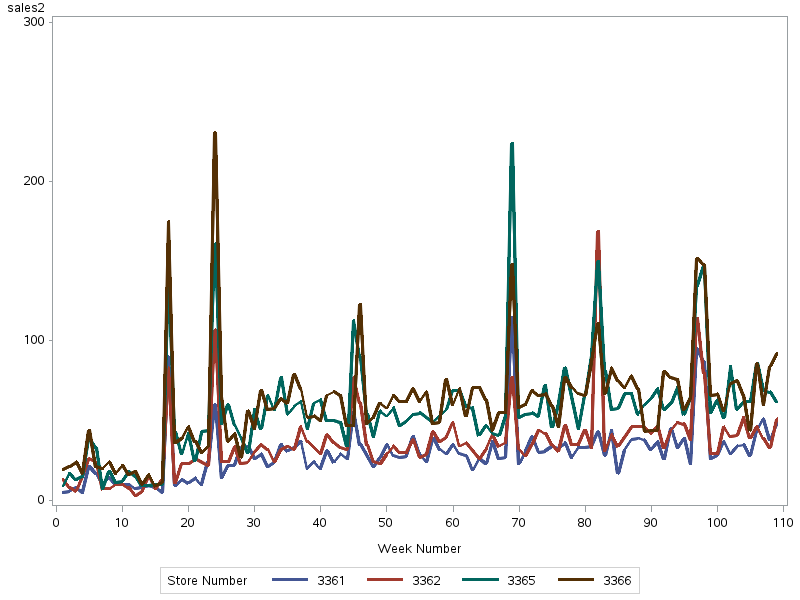
Figure 5 shows the sales performance of Herbal Essences across four stores (3361, 3362, 3365, and 3366) over 109 weeks.
Sales exhibit noticeable spikes at various times in all stores, possibly reflecting seasonal demand or effective promotional campaigns. Generally, stores 3366 and 3365 achieve higher sales volumes compared to stores 3361 and 3362, which may be attributed to factors such as location, store size, or local demographics.
Figure 6: Herbal Essences price trends in four stores
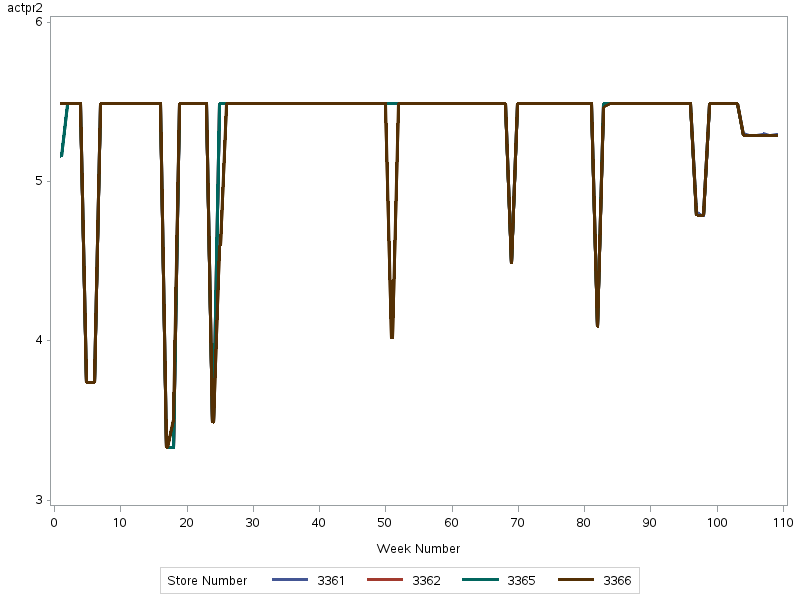
Figure 6 shows Herbal Essences prices over 109 weeks in four stores. The sharp price drops and recoveries suggest that the adjustment was planned rather than a random fluctuation. The timing of the price reductions correlates with the sales spikes shown in Figure 2, suggesting that lower prices stimulate customer demand. In addition, all stores use similar pricing strategies, suggesting a coordinated approach by central management.
2.3.3 Performance for TOP5 Brands
Figure 7: Price trends of TOP5 brands in four stores
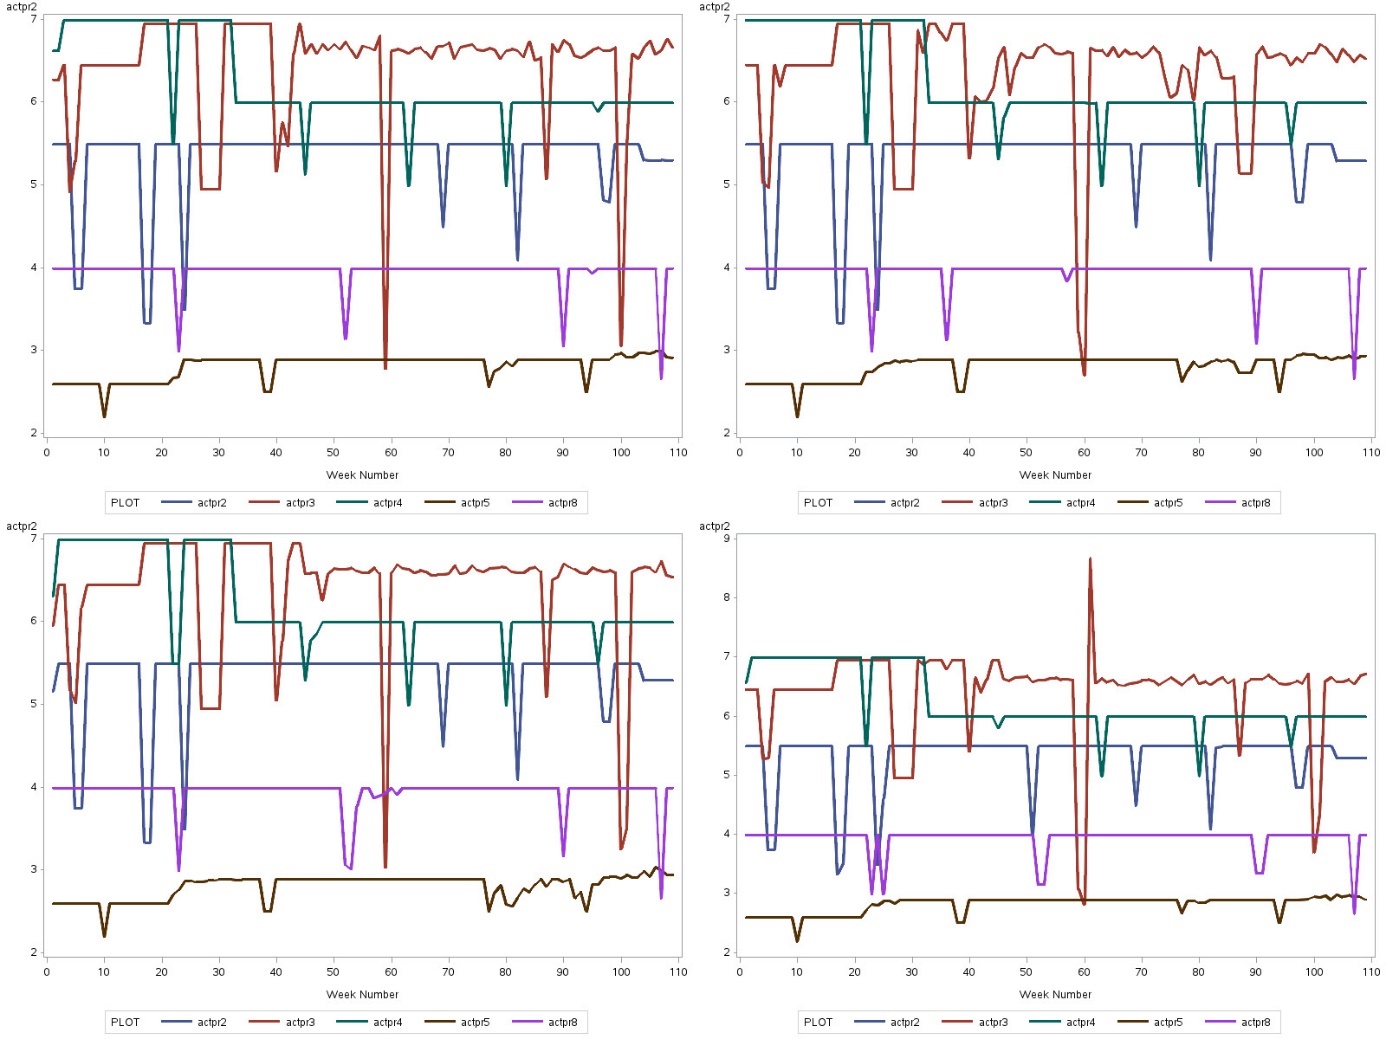
Figure 7 illustrates the price trends of TOP5 brands across four stores. Each graph represents a store. This figure shows the pricing strategies for the top five brands.
Garnier Fructis frequently adjusts its prices, with regular small changes and occasional large adjustments. Its regular price is the highest among the brands. When on sale, Garnier Fructis may be priced lower than the following brands, Herbal Essences, Dove, and L'Oréal Paris, thus competing strongly with them.
TRESemmé maintains the lowest regular prices with limited room for discounts, resulting in smaller price reductions. The chart also shows that several brands adjusted their prices at the same time, most likely in response to external market events such as holidays.
3.Model Specification
3.1 Model 1: Impact of Herbal Essences' Market Mix on Sales
In Model 1, variables including the actual price of Herbal Essences and various promotional strategies are incorporated to examine how the brand’s own market tactics influence its sales volume.
The equation for the Model 1 was:
3.2 Model 2: Impact of Herbal Essences' Market Mix on Sales with Store Fixed Effects
Model 2 includes store fixed effects to examine variation at the store level. By including dummy variables for each store, the model controls for store-specific factors that may affect sales.
The equation for the Model 2 was:
3.3 Model 3: Impact of TOP 5 Brands' Market
Mix on Sales with Store Fixed Effects**
Model 3 incorporates the actual prices of Garnier Fructis, Dove, TRESemmé and L'Oréal Paris to analyze how the pricing strategies of these top brands affect the sales of herbal essences while controlling for store-specific factors.
The equation for the Model 3 was:
4.Results
4.1 Model 1: Impact of Herbal Essences' Market Mix on Sales
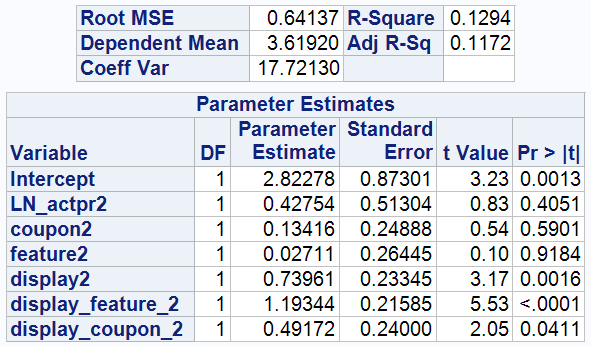
The model shows that the estimated value of the intercept is 22.82278, which can be interpreted as the baseline level of sales performance in the absence of active promotions or price reductions.
The coefficient for LN_actpr2 is not statistically significant (p-value = 0.4051), suggesting that changes in actual price of Herbal Essences might not reliably predict changes in the sales performance.
The coefficient for display_feature_2 is 1.19344, which is statistically significant (p-value <0.0001). This suggests that compared to not using promotions at all, the use of both display and featured promotions can have a large positive impact on sales. Specifically, sales would increase by 1.19344% compared to using no promotions.
The coefficient for Display_Coupon_2 is 0.49172, also indicating a positive effect on the dependent variable when display and coupon promotions are used together, and it is statistically significant (p-value = 0.0411).
The R-square is 0.1294, indicating the model explains approximately 12.94% of the variance in the sales, which is relatively low. This suggests that the model does not include other key variables that have a significant impact on the dependent variable.
4.2 Model 2: Impact of Herbal Essences' Market Mix on Sales with Store Fixed Effects
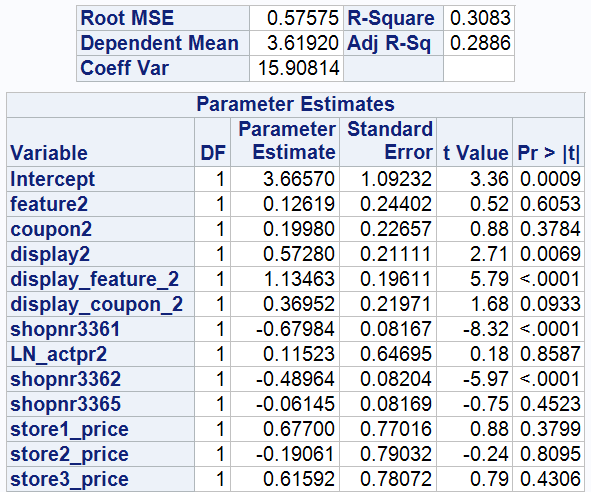
After including store fixed effects, the coefficients for display_feature_2 remain significant, indicating that combined display and feature promotions have a notably strong positive impact on sales. Store rn3361 and store rn3362 show a significant negative effect, indicating that these stores have lower sales compared to the reference store, with sales being 0.67984% and 0.48964% lower, respectively.
The R-squared value is 30.83%, which is higher than in Model 1, indicating that Model 2 is moderately effective. The coefficients for store1_price, store2_price, and store3_price are not statistically significant, indicating that there is little difference in price elasticity across stores.
4.3 Model 3: Impact of TOP 5 Brands' Market
Mix on Sales with Store Fixed Effects**
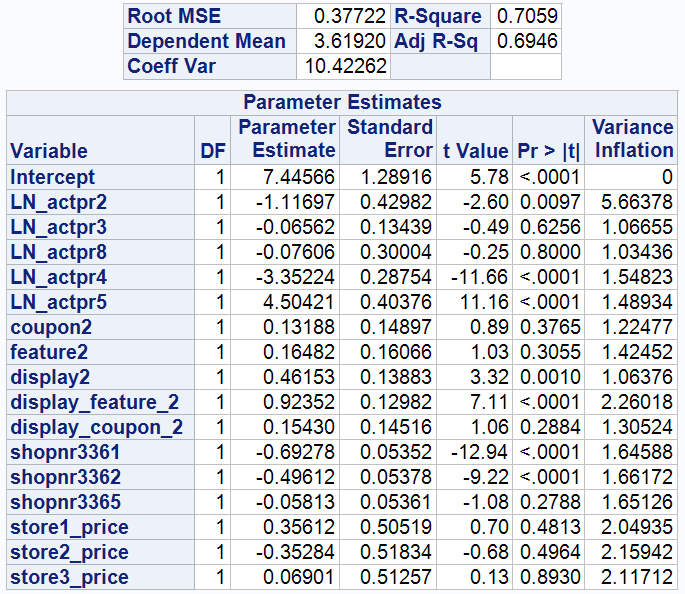
Compared to Model 2, the coefficient for display_feature_2 has decreased from 1.13463 to 0.92352 and remains statistically significant, indicating that the initial estimate was too high and has been adjusted with the introduction of new parameters.
The coefficient for LN_actpr2 is -1.11697, suggesting that the price of the focal brand negatively impacts its sales. Specifically, a 1% decrease in the focal brand's price leads to a 1.11697% increase in sales.
The coefficient for LN_actpr5 is 4.50421, indicating a significant impact of TRESemmé on the focal brand. A 1% price reduction for TRESemmé results in a 4.50421% decrease in Herbal Essences' sales.
The coefficient for LN_actpr4 is -3.35224, showing that a 1% price reduction for Dove increases Herbal Essences' sales by 3.35224%.
With an adjusted R-squared of 0.6946, the model explains a substantial portion of the variance in sales, indicating a good fit.
The Variance Inflation Factor (VIF) for LN_actpr2 is 5.66378. This suggests that there is a moderate level of multicollinearity involving LN_actpr2.
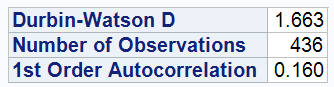
The Durbin-Watson test statistic falls between 0 and the lower bound (dl), leading to the rejection of the null hypothesis. This indicates positive autocorrelation in the residuals.
4.4 Model fitting
Figure 8: Comparison of Observed vs. Predicted Sales
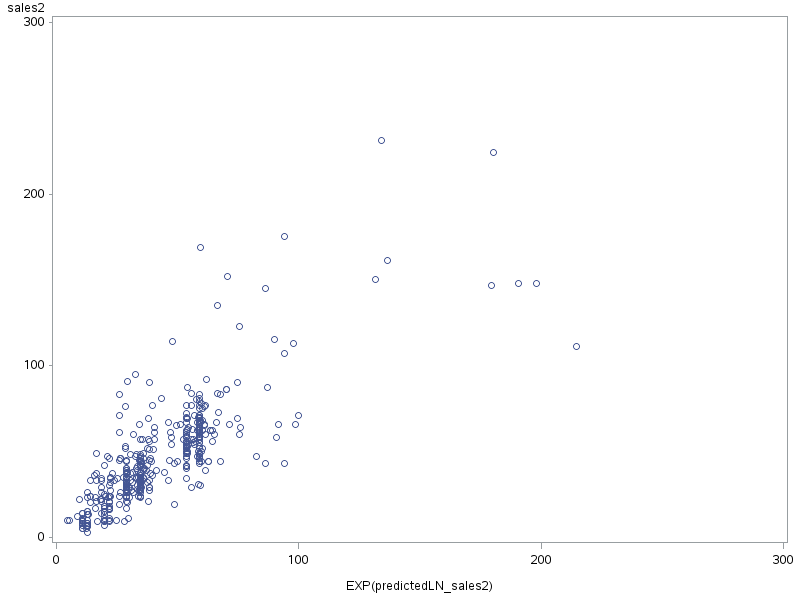
Figure 8 shows a scatter plot of observed sales for Herbal Essence against predicted sales.
The model shows accurate on predicts lower sales value, as these points are tightly clustered around the diagonal. However, as the sales values increase, the points begin to diverge from the diagonal line. This spread indicates that the model’s predictions for higher sales values are less accurate.
Figure 9: Predicting weekly sales for four stores
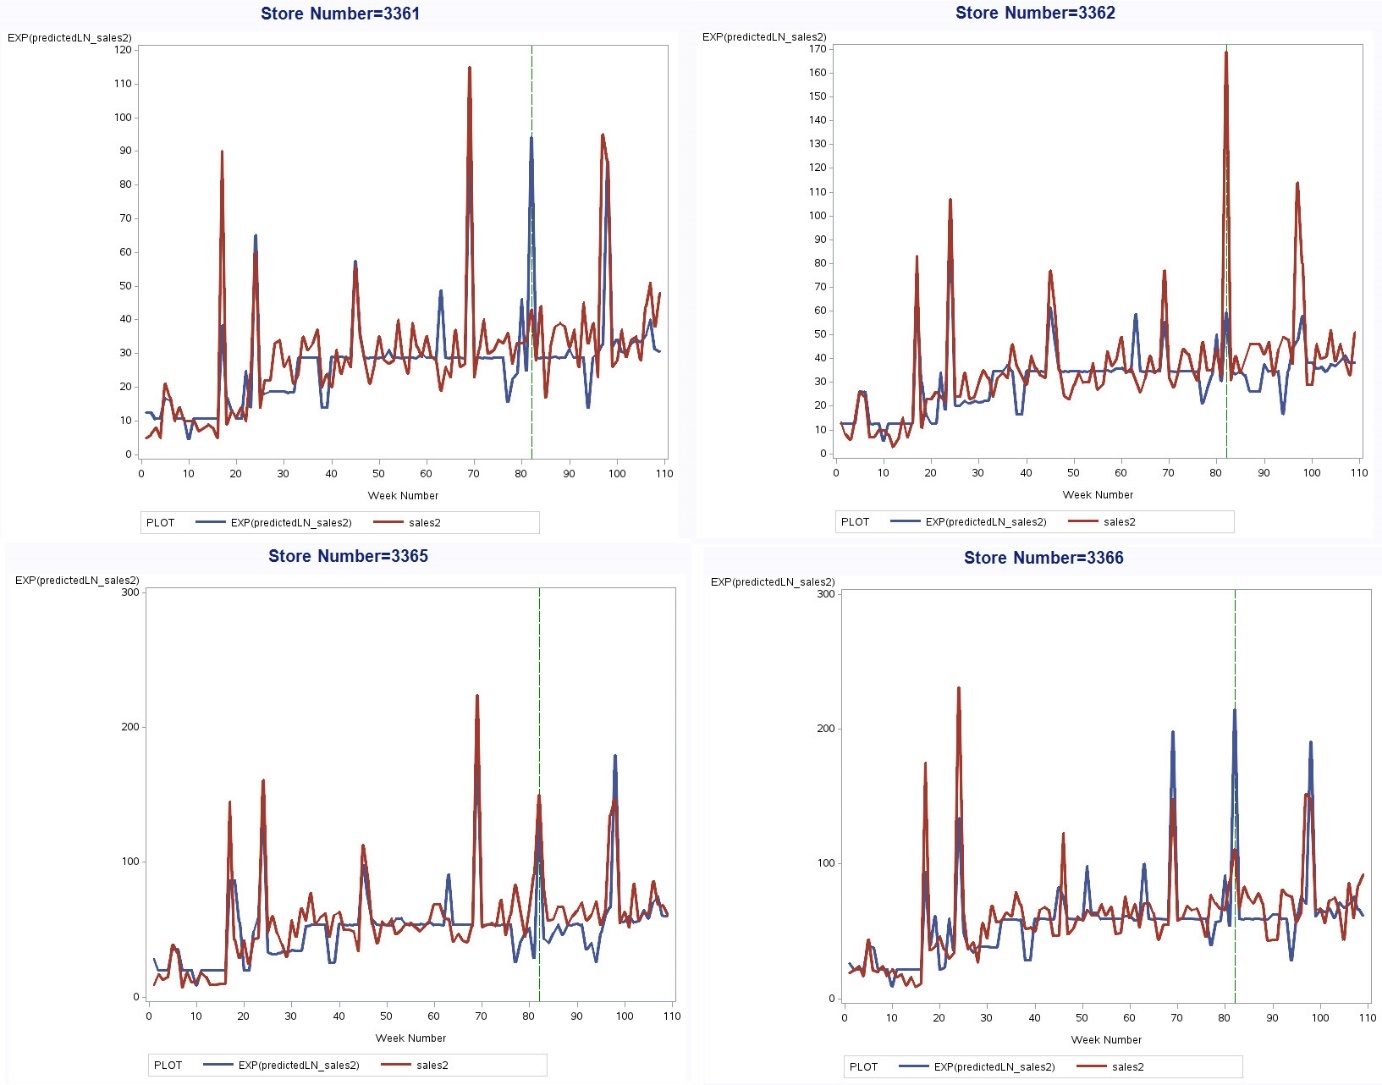
Figure 6 shows the model's performance in predicting weekly sales (units) for four different stores. Overall, the model demonstrates good fit, tracking sales data effectively across all stores. It performs best in predicting moderate sales levels but struggles with very high sales peaks or sudden spikes.
5. Discussion
Among the various promotional strategies for Herbal Essences, the combination of displays and features has a highly significant and strong positive effect on unit sales. This highlights the effectiveness of integrated marketing strategies. Visual displays and detailed features create a compelling reason for customers to buy. In order to uncover potential growth opportunities, companies should focus on applying and analyzing market mix strategies.(Zhang, 2006).
Baseline sales levels vary across stores, but price elasticity is consistent across these stores. Price elasticity is consistent across stores, indicating that customers respond similarly to price changes regardless of store. Therefore, a consistent pricing strategy can be used without considering differences in price sensitivity between stores. This approach simplifies pricing strategy(Hoch et al., 1995). In addition, other factors such as store location, local demographics(Giering, 2008), store size, customer service(Borucki & Burke, 1999) and local competition are likely to cause differences in baseline sales. Therefore, marketing strategies should focus more on these areas to improve store performance rather than relying solely on price adjustments.
The model shows that TRESemmé's price cuts had a significant negative impact on Herbal Essences' sales, indicating that TRESemmé is a direct competitive threat to Herbal Essences. Therefore, the focal brand needs to develop an effective competitive strategy. For example, if a competitor such as TRESemmé lowers its prices, the focal brand can respond by offering a variety of products, strengthening its brand loyalty program, or launching an aggressive marketing campaign.
The SCAN*PRO model performed well. However, it also showed moderate multicollinearity and positive autocorrelation. These problems suggest that the models may not fully capture some underlying patterns in the data. To address this, it will be important to identify the sources of multicollinearity - by examining the correlations between independent variables - and consider adjustments to the model. In addition, positive autocorrelation in the model residuals suggests that the model is failing to capture some pattern in the data that persists over time. To address this, future analyses could explore alternative models that better capture these patterns.