Multivariate Analysis of Work-Life Balance Indicators
Use of various multivariate analysis techniques to explore factors influencing work-life balance indicators, including PCA(principal component analysis), FA(factor analysis), cluster analysis, correspondence analysis, canonical correlation analysis, PLS regression.
Executive summary
This project uses different multivariate analysis techniques to explore factors influencing work-life balance indicators.
Principal component analysis explores how different variables contribute to the variance of the work-life balance score.
Factor analysis further explores the latent factors underlying the independent variables.
Cluster analysis helps to identify patterns and groupings between variables.
Correspondence analysis explores potential trends in work-life balance scores across different demographic groups.
Canonical Correlation Analysis reveals the relationships between different variable sets and their mutual influences.
PLS regression identifies the most influential variables in predicting work-life balance scores.
By integrating these analytical techniques, this project aims to comprehensively understand the factors that shape work-life balance, providing valuable insights for individuals, organizations and policymakers seeking to improve overall well-being.
1.Introduction
This project aims to explore different aspects that influence work-life balance indicators. Previous studies have primarily focused on aspects of work-life balance, such as compensation, workload, or remote working, without integrating a broader range of influencing factors.
This study aims to fill this gap using multivariate analysis techniques by examining how different aspects of an individual's life affect work-life balance. The factors examined cover five domains: ‘Healthy Body’, ‘Healthy Mind’, ‘Expertise’, ‘Connection’, and ‘Meaning’. Understanding these factors can support effective interventions that improve quality of life and productivity.
2.Materials and Methodologies
2.1 Materials
2.1.1 Dataset Description
The dataset for this project is a collection of responses from www.Authentic-Happiness.com. Data from a study evaluates how individuals shape their lifestyles, habits, and behaviors to optimize overall life satisfaction.
The dataset initially had 15,972 samples, from which 500 were selected for analysis.
Looking at Figure 1, the sample of respondents has slightly fewer men than women. Regarding age distribution, the most significant number of respondents is in the 21-35 age group, with the smallest proportion in the under-20 age group.
Figure 1: Sample distribution of respondents 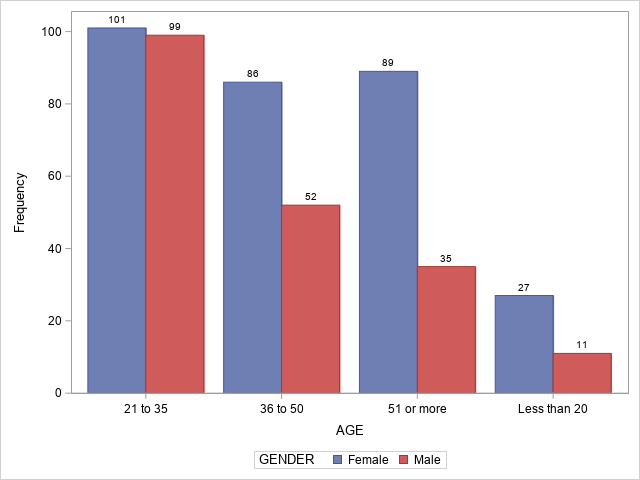
2.1.2 Variable Description
As shown in Table 1, this dataset contains 20 independent variables grouped into five categories:
(1) Healthy body
(2) Healthy mind
(3) Expertise: measuring the ability to grow one’s knowledge and achieve something unique
(4) Connection: assessing the strength of one’s social network and your inclination to discover the world
(5) Meaning, evaluating one’s compassion, generosity
In addition, the 'WORK_LIFE_BALANCE_SCORE', which ranges from 500 to 800, is used as an indicator to measure work-life balance. This indicator is calculated by an algorithm using the 20 independent variables.
Basic variables such as age and gender, as well as timestamps indicating when the questionnaire was completed, are also included in the dataset.
Table 1: Variable Definition
| Segment | Variable Name | Definition |
|---|---|---|
| Metadata | TIMESTAMP | Date when survey was completed |
| ID | [1 to 500] | |
| Demographic | age | Age range: ‘less than 20’, ‘21 to 35’, ‘36 to 50’, ‘51 or more’ |
| gender | ‘Male’ or ‘Female’ | |
| Target Variable | WORK_LIFE_BALANCE_SCORE | Calculated from five categories: Healthy Body, Healthy Mind, Connection, Expertise, Meaning |
| score_level | Level 1–6 based on WORK_LIFE_BALANCE_SCORE | |
| Healthy Body | fruits_veggies | Fruits or veggies eaten daily [1 to 5] |
| bmi_range | BMI range [1 if below 25, else 2] | |
| daily_steps | Thousands of steps walked daily [0 to 10] | |
| sleep_hours | Typical weekly sleep hours [0 to 10] | |
| Healthy Mind | daily_stress | Daily stress level [0 to 10] |
| flow | Daily hours of “flow” experience | |
| weekly_meditation | Weekly times spent self-reflecting [0 to 10] | |
| daily_shouting | Frequency of shouting/sulking weekly [0 to 10] | |
| Connection | places_visited | Number of new places visited yearly [0 to 10] |
| core_circle | Number of close people [0 to 10] | |
| supporting_others | Number of people helped yearly [0 to 10] | |
| social_network | Number of daily social interactions [0 to 10] | |
| Expertise | achievement | Remarkable achievements in last 12 months [0 to 10] |
| personal_awards | Recognitions received in last 12 months [0 to 10] | |
| time_for_passion | Daily hours doing passionate work [0 to 10] | |
| todo_completed | Weekly to-do list completion [0 = not at all, 10 = very well] | |
| Meaning | donation | Times donated time or money in a year |
| lost_vacation | Unused vacation days yearly [0 to 10] | |
| sufficient_income | 1 = insufficient, 2 = sufficient to cover basic expenses | |
| live_vision | Years ahead with a clear life vision [0 to 10] |
2.2 Methodologies
2.2.1 Data Preprocessing
(1) Standardized data
Examining the range of variables revealed differences in the scales used to measure factors affecting work-life balance. This means that the data needs to be standardized.
Table 2: Range of independent variables
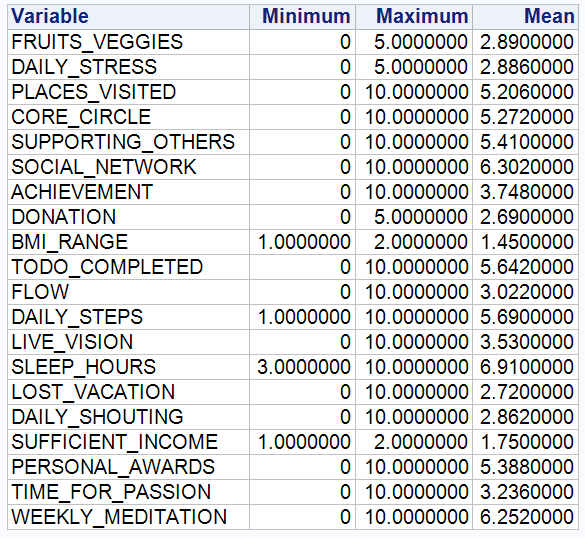
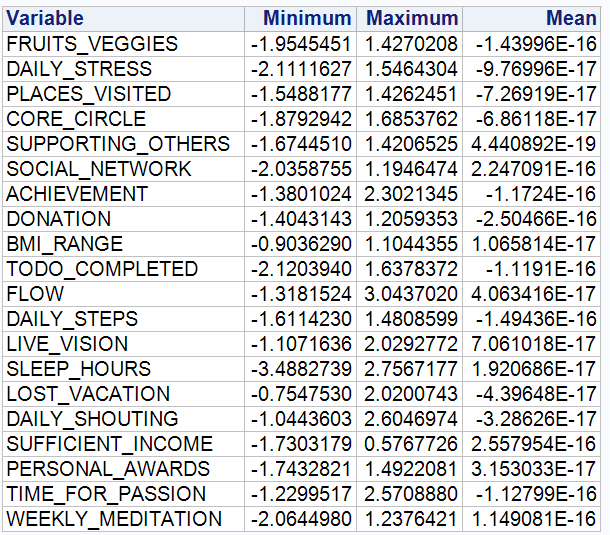
Each independent variable was standardized to have a mean of 0 and a variance of 1. The mean of each variable was then checked to see if it was close to 0 after processing to ensure standardization was correct.
Table 3: Range of standardized independent variables
(2) Create a new column
For ease of analysis, a new variable 'score_level' has been created based on the 'WORK_LIFE_BALANCE_SCORE' to classify the sample into six levels:
Level '1': Scores less than or equal to 550.
Level '2': Scores between 551 and 600.
Level '3': Scores between 601 and 650.
Level '4': Scores between 651 and 700.
Level '5': Scores between 701 and 750.
Level '6': Scores greater than 750.
2.2.2 Methods of Multivariate Analysis
(1) Principal Component Analysis (PCA)
PCA identifies patterns in data by transforming variables into a new set of uncorrelated variables called principal components. This study uses PCA to examine how variables contribute to the variance in work-life balance scores and identify which variables are primarily responsible for differences in these scores.
(2) Factor Analysis
This study uses factor analysis to understand the essential drivers among the 20 predictor variables. Maximum likelihood extraction is used to identify the latent factors underlying the observed variables. In addition, orthogonal varimax rotation is applied to improve the interpretability of the factors.
(3) Cluster Analysis
Cluster analysis is a statistical technique to identify groups of similar objects or individuals within a dataset. This study uses the VARCLUS procedure to perform a clustering analysis on the variables. This technique groups variables based on similarities and identifies clusters exhibiting similar patterns.
(4) Correspondence analysis
Correspondence analysis examines trends in the distribution of work-life balance scores across different demographic groups(age and gender). It assesses whether specific distribution patterns exist within these groups.
(5) Canonical Correlation Analysis
Canonical correlation analysis explores the relationships between different variable sets and how they influence each other. This study examines the correlations between different sets of predictor variables and their impact on work-life balance outcomes.
(6) Partial Least Squares (PLS) regression analysis
PLS regression analysis determines the relative importance of variables in predicting work-life balance scores. As the work-life balance score is derived from 20 predictor variables using a specific algorithm, PLS regression helps to identify which variables play a significant role in the prediction model.
3.Result
3.1 Principal Components Analysis
Principal component analysis is performed to investigate which indicators best explain the variance in work-life balance scores.
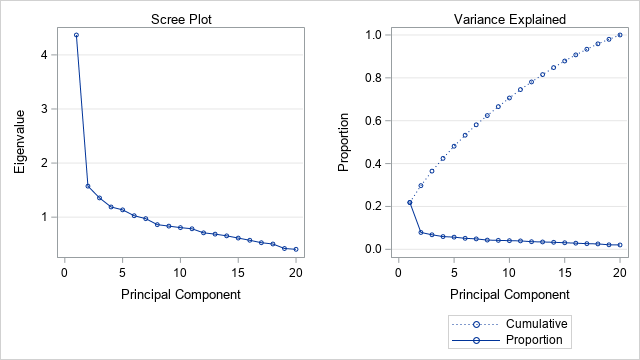
Figure 2 underscores the importance of the first principal component, with an eigenvalue of 4.37. This component is responsible for a substantial portion, 21.84%, of the total variance, thereby containing the most significant information.
Table 2: Eigenvalues of correlation matrix in PCA
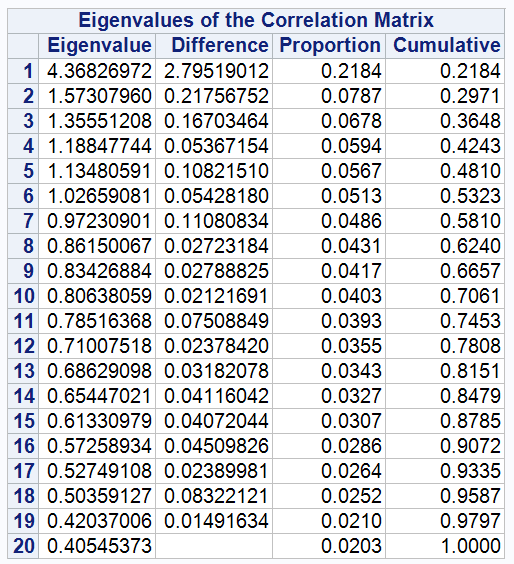
The Scree plot in figure 2 shows a rapid eigenvalue decrease after the first principal component. Subsequent values gradually stabilize. In addition, the Variance Explained plot shows that the first two principal components cumulatively explain about 30% of the variance.
Figure 2: PCA scree plot
Although principal components 1 and 2 do not fully explain the variance, they still contain important information. Therefore, to find out how the variables affect the variance in work-life balance scores, it is decided to focus on these first two principal components for an in-depth study.
Figure 3: PCA component pattern
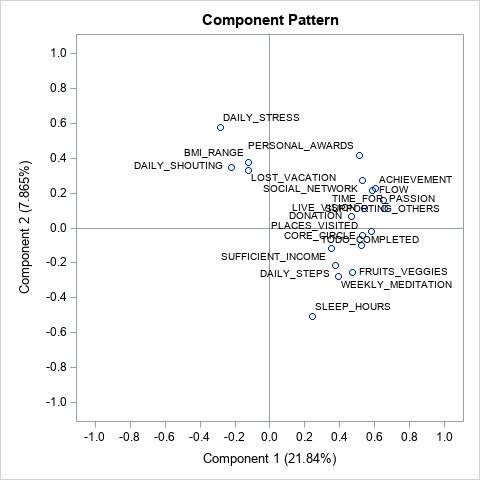
Figure 3 shows the loadings of each variable on the first two principal components.
For component 1, variables associated with personal accomplishment and satisfaction, such as 'Time for Passion', 'Flow', and 'Supporting Others', have high positive loadings. This suggests that they significantly contribute to explaining the variance in the first principal component. The high positive loadings of these variables also suggest potential relationships that collectively influence people's life satisfaction and well-being.
Regarding component 2, variables such as 'daily stress' have significant positive loadings. Health-related habits such as 'hours of sleep', 'weekly meditation', and 'daily steps' have negative loadings. The second principal component is, therefore, likely to be related to individuals' health and vitality. This implies that stress management and health maintenance significantly affect individuals' work-life balance scores.
Figure 4: PCA component scores
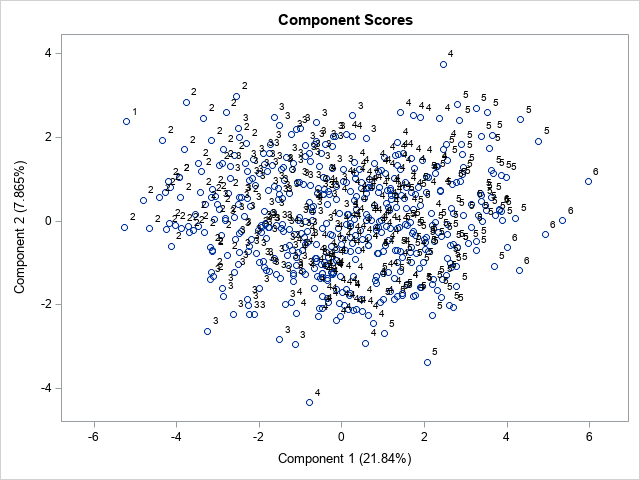
Figure 4 shows the distribution of the samples under the two principal components. The number on each sample point represents the level of the sample's work-life balance score. Lower numbers indicate poorer work-life balance.
Principal Component 1 (horizontal axis): Samples with higher work-life balance scores appear more concentrated to the right of the center while lower-scoring samples tend to be to the left. This suggests a possible link between principal component 1 and some of the positive factors that influence work-life balance, such as greater personal fulfilment and satisfaction.
Principal Component 2 (vertical axis): Samples with lower work-life balance tend to be higher, while samples with higher balance are relatively lower. This suggests that the principal component 2 captures factors negatively associated with work-life balance.
3.2 Factor Analysis
Factor analysis is used to discover the underlying factors determining work-life balance scores and identify relationships between variables and common influences. Due to the large sample size, Maximum Likelihood Factor Analysis (MLFA) was used to extract the factors. The results obtained are presented in Table 3.
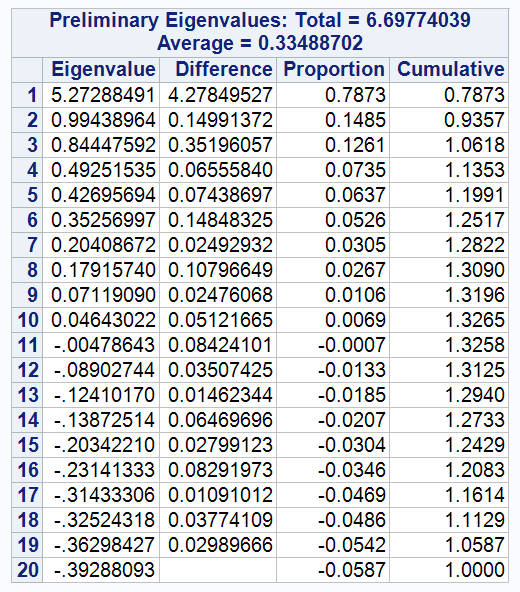
According to the results, the first factor has the highest eigenvalue (5.27) and explains 78.73% of the variance. This indicates that the first factor is the main source of variance in the data and plays a very important role in it.
The second factor has an eigenvalue of 0.99 and explains 14.85% of the data's variance. Although it provides much less information than the first factor, it still provides a significant amount of information.
The cumulative proportion of variance explained by these two factors is over 90%. It is therefore decided to retain these two factors to capture most of the variation in the data.
Table 3: FA preliminary eigenvalues
After applying the varimax orthogonal rotation method, the results are as follows.
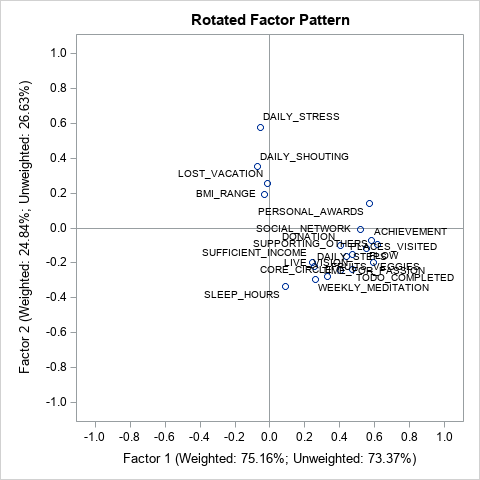
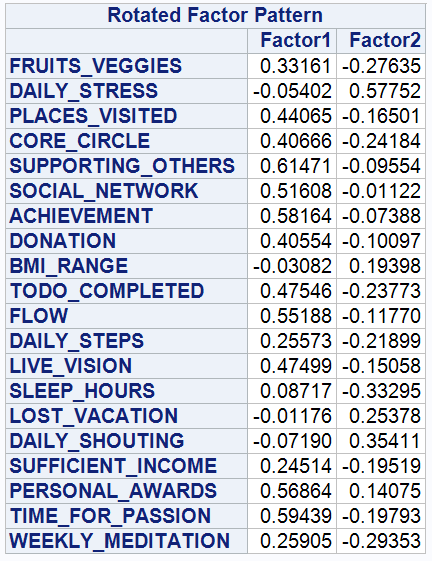
Factor 1 (explains 75.16% of the variance): The variables with high loadings include achievement, support for others, social network, and personal awards, primarily associated with social interactions, achievement and support for others. This suggests that Factor 1 may represent an individual's achievements and interactions within their social environment.
Factor 2 (explains 24.84% of the variance): Variables with high positive loadings relate to personal stress levels and health status, such as daily shouting, daily stress, and BMI. Conversely, good recovery habits and a healthy lifestyle are associated with high negative loading variables such as hours of sleep and weekly meditation. Therefore, Factor 2 can be interpreted as representing health and stress management, which includes living habits and stressors affecting individual health status.
Figure 5: Result of the FA rotated factor pattern
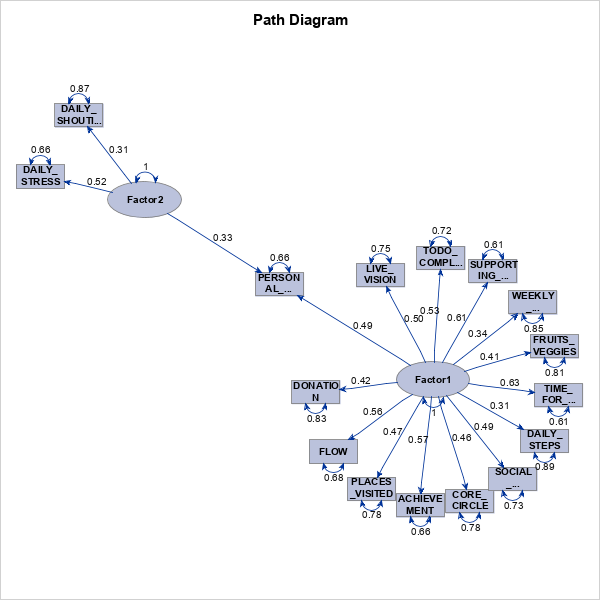
The path diagram in figure 6 shows how the variables are related to each other through the factors. The numbers next to each variable indicate its loading on the corresponding factor, representing the degree of association between the variable and the factor. Higher loadings indicate more significant contributions of the variables to the factor.
Factor 1 links several variables: achievement (0.86), places visited (0.78), and flow (0.68). The high loadings of these variables indicate their importance within this factor. They are typically related to personal achievement and life satisfaction.
Factor 2: Associated with Daily Stress (0.86) and Daily Shouting (0.87), indicating high loadings related to stress and emotional management in daily life.
The findings in the path diagram are consistent with those in the factor pattern figure.
Figure 6: FA path diagram
3.3 Cluster Analysis
Cluster analysis results illustrate how variables are grouped based on similarities, providing insight into which variables exhibit similar behaviors. As shown in table 4, five clusters were ultimately identified.
Table 4: Result of cluster analysis
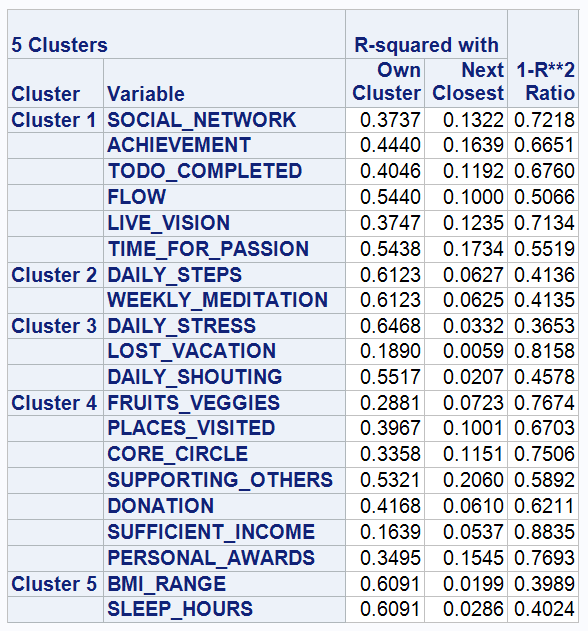
Figure 7: Dendrogram of cluster analysis
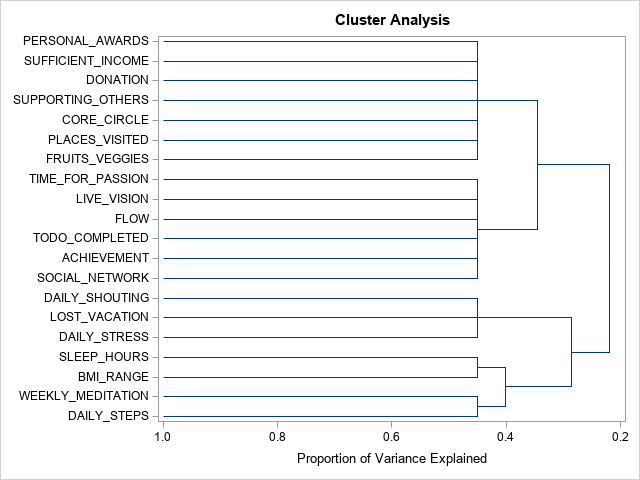
Figure 7 shows the dendrogram of cluster analysis, we can see five clusters in the graph.
Cluster 1: This cluster focuses on personal achievement and social interaction, including Social Network, Achievement, to-Do Completed, Flow, Live Vision, and Time for Passion. These variables reflect individuals' pursuit of and enthusiasm for personal success. This suggests that individuals in this cluster are highly self-directed and have excellent social skills, which help them build meaningful professional and personal relationships.
Cluster 2: Focuses on daily health habits, including Daily Steps and Weekly Meditation. This suggests that the variables in this cluster are associated with physical activity and mental well-being. Focusing on this can positively affect overall quality of life, help to reduce stress, and increase overall happiness.
Cluster 3 deals with stress and emotion management, including Daily Stress, lost vacation, and Daily Shouting. This cluster focuses on issues related to stress. High levels of stress and limited time to relax (lost vacation) can lead to health problems and decreased life satisfaction.
Cluster 4: Relates to social interaction and life satisfaction, including fruits and vegetables, places visited, core circle, supporting others, giving, sufficient income and personal awards. Social interactions and expanding social circles are associated with these variables. They reflect individuals' activities in maintaining social relationships and community involvement. These are typically associated with higher life satisfaction and personal well-being.
Cluster 5: This cluster relates to health monitoring, including BMI range and sleep hours. These variables focus on health indicators and lifestyle habits, particularly weight management and sleep quality.
3.4 Correspondence Analysis
A correspondence analysis is carried out to see if there are patterns in the distribution of work-life balance scores across different demographic groups. In other words, this analysis aims to see if certain groups have higher levels of low life satisfaction.
The table below was obtained after grouping and aggregating the statistics for different demographics. The table shows that scores for different demographic groups follow a similar trend to the overall distribution, with higher frequencies in the middle and lower frequencies at the extremes. There are no apparent patterns in the distribution of demographic work-life balance scores.
Table 5: Result of correspondence analysis 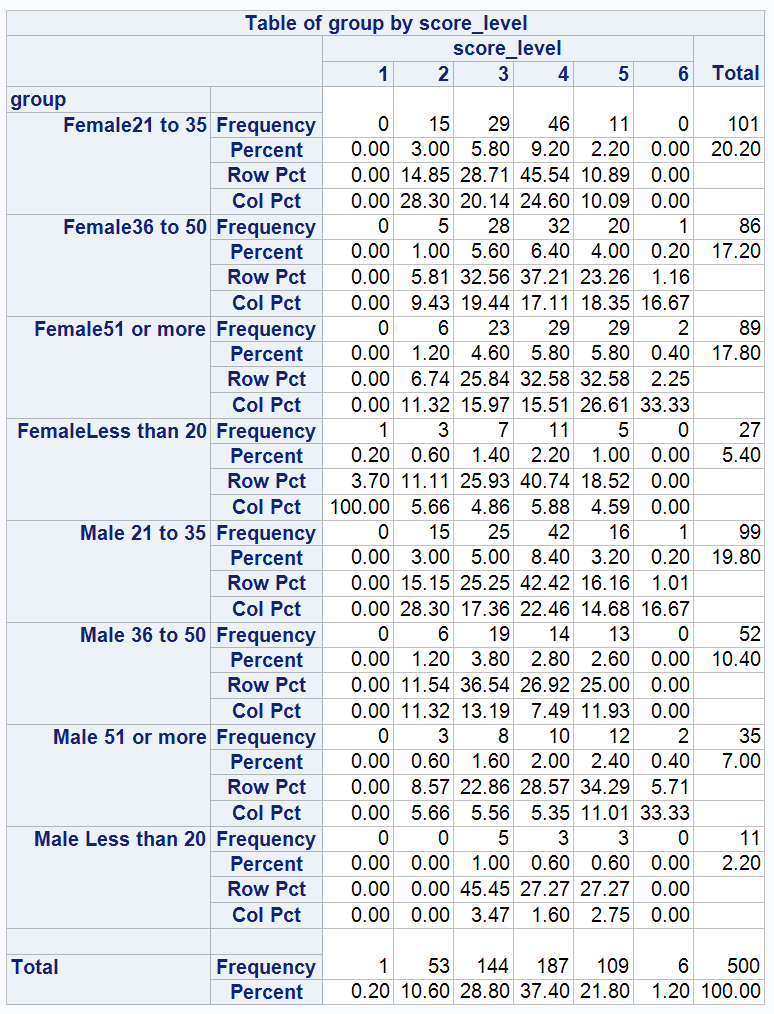
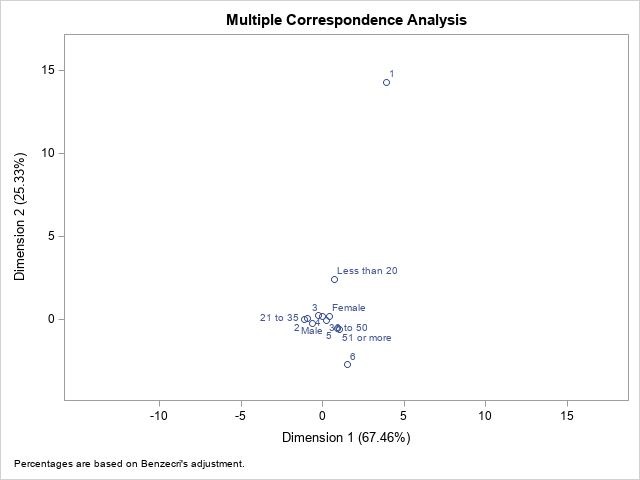
Figure 8 shows the correlation between score levels across gender and age groups.
Except for one outlier, most gender and age categories are clustered near the center of the graph. This clustering suggests that gender and age may have a limited effect on the observations. If age and gender significantly impacted the results, we would see a more comprehensive distribution or pattern of different age and gender categories throughout the graph.
Figure 8: Result of multiple correspondence analysis
3.5 Canonical Correlation Analysis
Canonical Correlation Analysis explores the relationships between different sets of variables. This analysis examines three combinations: 'healthy mind and healthy body', 'connection and expertise', and 'meaning and expertise'.
Table 6: Correlations between healthy mind and healthy body
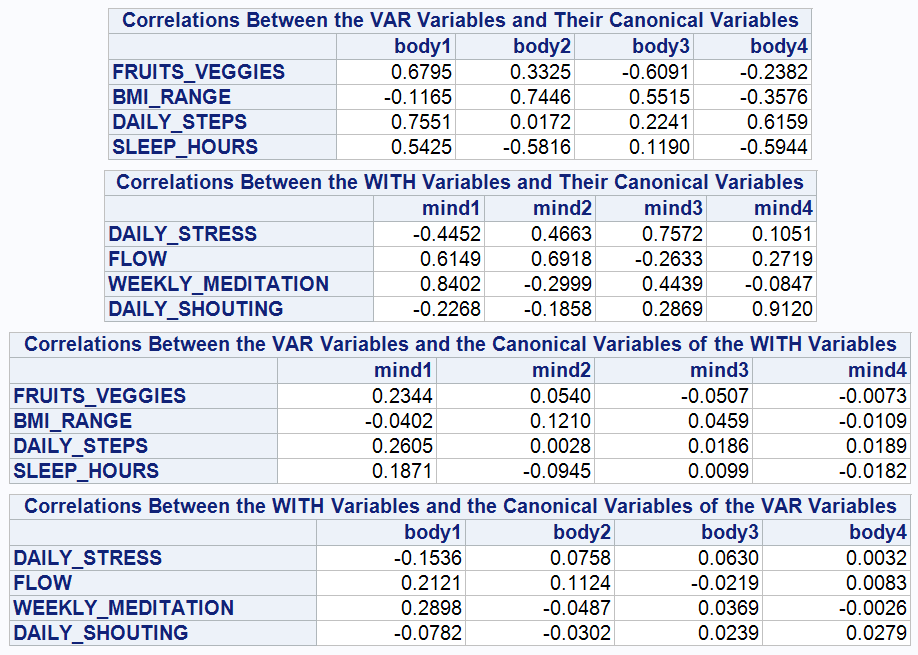
(1) Healthy mind and healthy body
The correlations of FRUIT_VEGGIES and DAILY_STEPS with body1 are 0.6795 and 0.7551, respectively, indicating a strong positive correlation. This high correlation suggests that dietary habits and regular physical activity play a significant role in improving physical health. In addition, these two variables are also positively correlated with mind1, further emphasising their importance in promoting emotional well-being.
The correlation coefficient between Weekly Meditation and Mind1 is 0.8402, indicating a strong positive correlation between regular meditation and a healthy mind. Furthermore, the correlation coefficient between Weekly Meditation and body1 is 0.2898, indicating a weak positive correlation between meditation and physical health indicators. Weekly meditation is, therefore, essential in improving overall well-being.
(2) Connection and expertise
Table 7: Correlations between connection and expertise
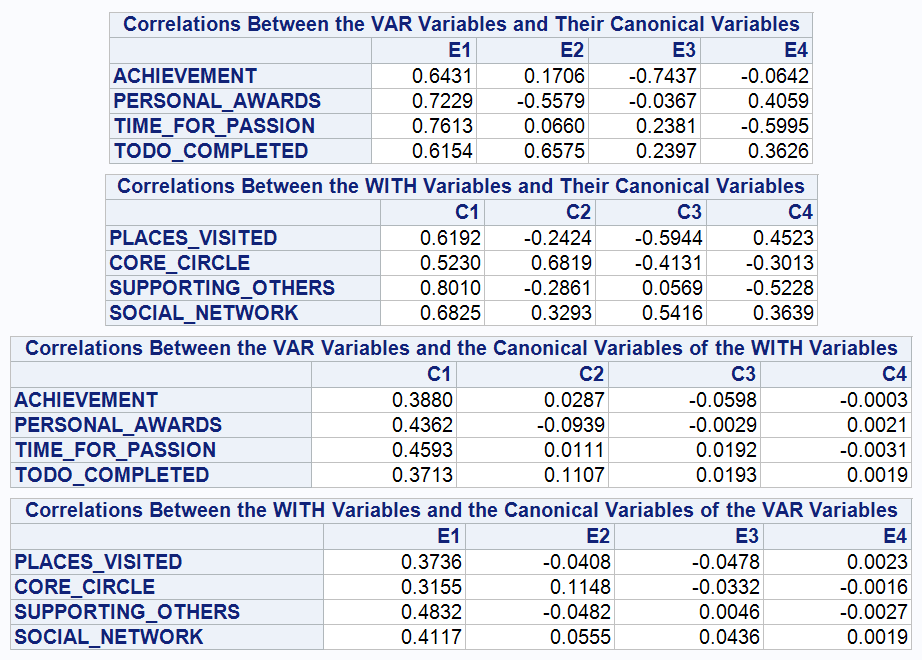
The high correlation between 'Time for Passion' and E1 (0.7613) strongly suggests that an individual's investment in pursuing their interests and passions is essential in achieving personal fulfilment.
In addition, the positive correlation between 'Time for Passion' and C1 (0.4593) suggests that pursuing one's passions is related to internal fulfilment and external social networks. This suggests that investing time in one's passions contributes to internal fulfilment and expands one's social circle and life experiences, further enhancing life satisfaction.
The high correlation (0.8010) of 'Supporting Others' with C1 suggests that this behaviour is a core component of building and maintaining a social network. 'Supporting others' is a meaningful way to build trust and social connections.
Meanwhile, the significant positive correlation between 'Supporting Others' and E1 (0.4832) further emphasises that helping others can contribute to an individual's career success. This may be because helping others builds positive interpersonal relationships and a positive social image, which is essential for career success.
(3) Meaning and expertise
Table 8: Correlations between meaning and expertise 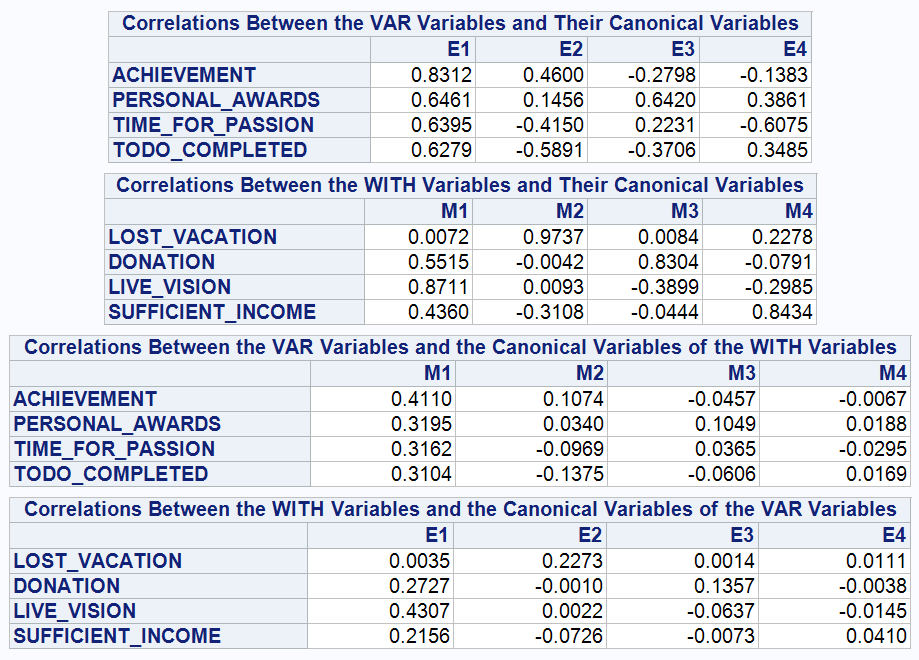
'Achievement' correlates most strongly with E1 (0.8312), indicating that 'achievement' is most represented in the 'expertise' variable set.
In addition, the correlation between 'achievement' and M1 is 0.4110, indicating that personal achievement is positively related to realising life visions. This relationship suggests that reaching higher levels of professional achievement may be closely related to achieving a sense of meaning and fulfilment in one's life.
The high correlation (0.8711) of 'LIVE_VISION' with M1 indicates that personal life vision is critical in the 'Meaning' variable set.
Meanwhile, the correlation between 'LIVE_VISION' and E1 was 0.4307, further emphasising the positive relationship between an individual's life vision and professional achievements. This suggests that an individual's professional development often interacts with and reinforces their life goals and visions.
3.6 PLS Regression
The work-life balance score is derived from 20 predictor variables using an algorithm. This raises the question of which variables are more influential in the prediction model. A PLS regression analysis was therefore conducted to answer this question.
Figure 9: Variable importance plot
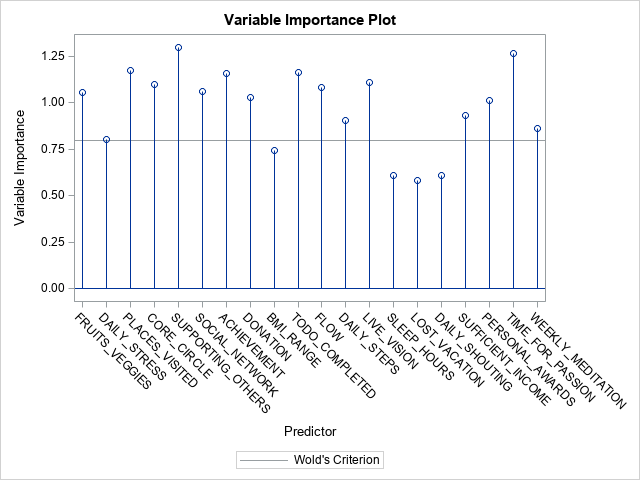
(1) Significant variables:
Time for passion: Making time for personal passions or hobbies is essential for a balanced life.
Supporting others: Supporting others is essential in strengthening social connections and improving overall life satisfaction.
Achievement: Accomplishing is essential for boosting individual self-esteem and motivation.
Places visited: Visiting different places can enrich personal cultural experiences and social interactions, positively impacting the quality of life.
(2) Variables of lesser importance:
Daily shouting: seems to have less importance in the prediction model
Lost vacation: Although the loss of holiday time can increase stress, its relative importance in this analysis is low, suggesting that other factors may play a more central role in individuals' lives.
Sleep hours: Although adequate sleep is crucial for health, sleep hours may not be as significant as other factors in determining work-life balance.
4.Discussion
4.1 Summary of Key Findings
In this study, extensive analyses of the work-life balance dataset were carried out using various multivariate analysis techniques, leading to several significant findings:
(1) PCA revealed several vital variables explaining the variance between work and life satisfaction. In the first principal component, 'Time for Passion', 'Flow' and 'Supporting Others' had high positive loadings, indicating their significant contribution to people's overall life satisfaction and happiness. In contrast, the second principal component highlighted the importance of health-related habits and stress management, such as "Daily Stress", "Sleep Hours", and "Weekly Meditation", in influencing work-life balance scores.
(2) In the FA, the rotated factor structure identified the underlying factors behind each predictor variable in the factor analysis. The first factor relates primarily to social support and a sense of accomplishment. In contrast, the second factor emphasizes the importance of health and stress management.
(3) Cluster analysis revealed five clusters based on which variables were most similar, forming distinct groups: ‘Personal Achievement and Social Interaction’, ‘Daily Health Habits’, ‘Stress and Emotion Management’, ‘Social Interaction and Life Satisfaction’, and ‘Health monitoring’.
(4) Correspondence analysis examined the effect of gender and age on observed variables across demographic groups. No significant distributional differences were observed between different gender and age groups, suggesting that gender and age may not significantly impact the variables under investigation.
(5) Canonical correlation analysis revealed significant relationships between three different sets of variables: ‘Healthy Mind and Healthy Body’, ‘Connection and Expertise’, and ‘Meaning and Expertise’. Each of these variables showed significant correlations.
(6) The PLS regression analysis shows that variables such as 'Time for passion' and 'Supporting others' play a significant role in predicting the work-life balance score, being the most influential variables in the model. Conversely, 'daily shouting', 'loss of vacation' and 'sleeping hours' are identified as the least influential variables in the model.
4.2 Insights and Interventions
The results of the study provide practical insights into work-life balance.
First, in terms of policy and workplace interventions, key variables such as 'time for passion', 'flow' and 'support for others' highlight the need for workplaces to promote personal growth and social support. It can be beneficial to introduce flexible working hours, encourage leisure activities and improve social networks(Odeloye et al., n.d.).
In addition, with regard to health and well-being programs, the importance of healthy habits and stress management in achieving work-life balance highlights the need for comprehensive well-being programs, including the provision of stress workshops and mental health resources(n.d.).
4.3 Future Avenues for Research
Despite the valuable insights gained from this study, several potential avenues for future research need to be explored.
First, one’s work-life balance score may evolve naturally over time, even without the influence of external variables(J. Navarro et al., 2015). Therefore, future research could extend these findings by examining changes in the indicators over time, thereby revealing the nature of work-life balance over time or under different external influences.
Secondly, the impact of cultural norms and values on work-life balance could be explored by examining these variables in different cultural contexts.
Finally, although this study found no significant effects of gender and age, further research using different analyses could determine whether there are potential effects not captured in this study.
5.Conclusion
This study used various multivariate analysis techniques to examine work-life balance factors, focusing on five categories of predictor variables. Given the study's limited scope, only a few selected multivariate methods were used to analyse the data. While valuable insights were gained, the complexity of the factors influencing work-life balance outcomes requires further exploration with a larger dataset and more advanced analytical techniques.