Economic Downturn and Child Poverty in New Zealand
This project explores how long-term unemployment impacts child poverty across different poverty thresholds in New Zealand, using socio-economic data and correlation analysis.
1. Research Focus
This report explores New Zealand’s socio-economic data. Based on initial findings, it focuses on how the economic downturn has affected child well-being—particularly poverty.
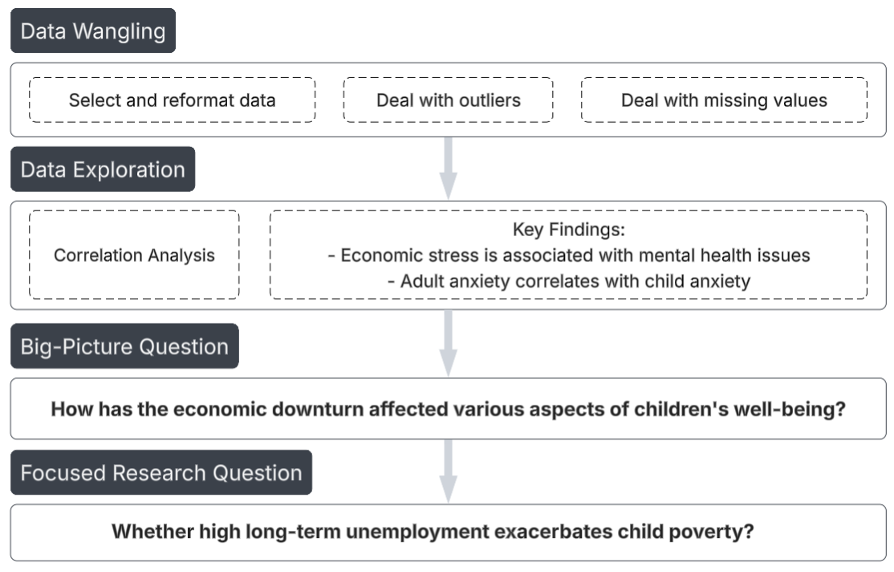
2. Overview of Analytical Workflow
3. Summary of Key Findings
- The higher the unemployment, the more children fall into poverty—this is true across all poverty levels.
- Children in the poorest households (40% threshold) are consistently affected when unemployment rises.
- In families closer to the poverty line (50% and 60%), the connection between job loss and child poverty goes up and down more, likely affected by external factors such as policy, economic shifts, or support programs.
4. Key Findings
Long-Term Unemployment and Child Poverty
Research Question
How does long-term unemployment influence child poverty across different poverty thresholds?
Lagged correlation analysis was conducted between the long-term unemployment rate and child poverty rates under three poverty thresholds (40%, 50%, 60% of median income):
Key Insights
- Positive correlation: Child poverty increases as long-term unemployment rises, across all poverty thresholds.
- Deeper poverty is more sensitive: The lower the poverty threshold, the stronger the correlation.
- Interpretation: Economic shocks affect the poorest families most severely, increasing the likelihood of children falling into deep poverty.
Figure 1. Lagged Unemployment and Child Poverty Rates (2012–2020)
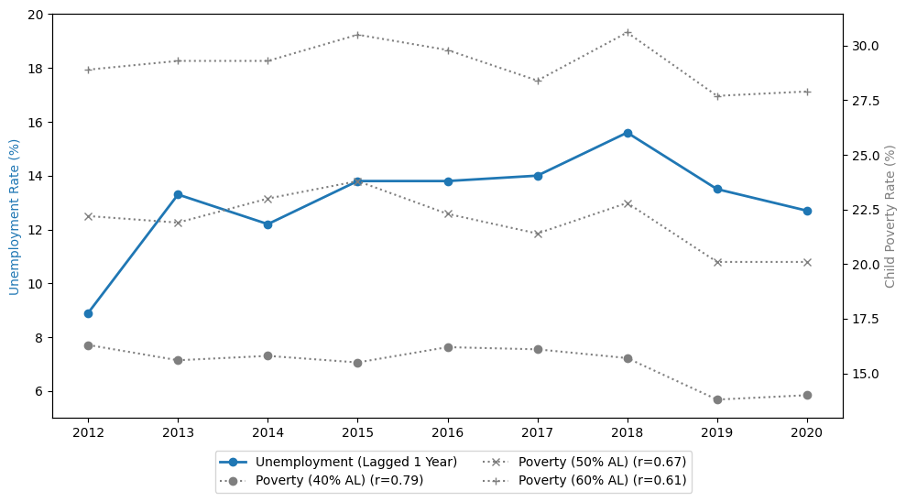
Table 1. 1-Year Lag Correlation: Unemployment and Child Poverty
| Poverty Line | 1-Year Lag Correlation with Unemployment |
|---|---|
| 40% Median | 0.79 (strongest) |
| 50% Median | 0.67 |
| 60% Median | 0.61 |
Temporal Trends in Correlation
Research Question
How does the correlation between the long-term unemployment rate and the three child poverty rates vary over time?
Key Insights
- The 40% poverty line shows a stable and strong correlation with long-term unemployment.
→ Suggests that children in deep poverty are consistently affected by unemployment, with fewer external disruptions. - Correlations for the 50% and 60% poverty lines fluctuate more, possibly due to various external factors such as policy, economic shifts, or support programs.
In short: When the economy worsens, children in the deepest poverty are the most reliably and persistently affected.
Figure 2. Rolling Correlation of Unemployment and Child Poverty (2013–2020)
Note: Calculated using a 3-year rolling window. Correlation reflects delayed effects of unemployment.
📌 Full Analysis Available
This summary is based on a complete analysis using real-world datasets.
🔗 View the full Jupyter Notebook and analysis on GitHub